


Kamas CCD, Summit County, Utah
About
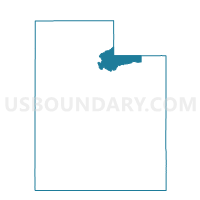
Outline

Summary
| Unique Area Identifier | 154740 |
| Name | Kamas CCD |
| County | Summit County |
| State | Utah |
| Area (square miles) | 1,086.54 |
| Land Area (square miles) | 1,080.96 |
| Water Area (square miles) | 5.58 |
| % of Land Area | 99.49 |
| % of Water Area | 0.51 |
| Latitude of the Internal Point | 40.80328280 |
| Longtitude of the Internal Point | -110.76320500 |
| Total Population | 6,763 |
| Total Housing Units | 4,945 |
| Total Households | 2,292 |
| Median Age | 33.8 |
Maps

Graphs
Select a template below for downloading or customizing gragh for Kamas CCD, Summit County, Utah


Neighbors
Neighoring County Subdivision (by Name) Neighboring County Subdivision on the Map
- Bridger Valley CCD, Uinta County, WY
- Coalville CCD, Summit County, UT
- Evanston CCD, Uinta County, WY
- Green River South CCD, Sweetwater County, WY
- Heber City East CCD, Wasatch County, UT
- North Duchesne CCD, Duchesne County, UT
- North Wasatch CCD, Wasatch County, UT
- Uintah and Ouray CCD, Wasatch County, UT
- West Daggett CCD, Daggett County, UT
Top 10 Neighboring Place (by Population) Neighboring Place on the Map
- Kamas city, UT (1,811)
- Oakley city, UT (1,470)
- Francis town, UT (1,077)
- Marion CDP, UT (685)
- Hideout town, UT (656)
- Woodland CDP, UT (343)
- Samak CDP, UT (287)
- Peoa CDP, UT (253)
- Lonetree CDP, WY (49)
Top 10 Neighboring Unified School District (by Population) Neighboring Unified School District on the Map
- Wasatch School District, UT (23,530)
- Duchesne School District, UT (18,607)
- Uinta County School District 1, WY (14,618)
- Sweetwater County School District 2, WY (13,657)
- South Summit School District, UT (7,001)
- North Summit School District, UT (4,922)
- Uinta County School District 4, WY (3,252)
- Daggett School District, UT (1,059)
Top 10 Neighboring State Legislative District Lower Chamber (by Population) Neighboring State Legislative District Lower Chamber on the Map
- State House District 54, UT (42,563)
- State House District 53, UT (37,757)
- State House District 18, WY (9,703)
- State House District 19, WY (8,191)
Top 10 Neighboring State Legislative District Upper Chamber (by Population) Neighboring State Legislative District Upper Chamber on the Map
- State Senate District 26, UT (101,392)
- State Senate District 19, UT (91,855)
- State Senate District 14, WY (19,890)
- State Senate District 15, WY (16,793)
Top 10 Neighboring 111th Congressional District (by Population) Neighboring 111th Congressional District on the Map
- Congressional District 1, UT (906,660)
- Congressional District 2, UT (890,993)
- Congressional District (at Large), WY (563,626)
Top 10 Neighboring Census Tract (by Population) Neighboring Census Tract on the Map
- Census Tract 9405, Wasatch County, UT (8,614)
- Census Tract 9753, Uinta County, WY (7,761)
- Census Tract 9752, Uinta County, WY (6,505)
- Census Tract 9403, Duchesne County, UT (3,847)
- Census Tract 9707, Sweetwater County, WY (3,709)
- Census Tract 9642.01, Summit County, UT (3,605)
- Census Tract 9642.02, Summit County, UT (3,055)
- Census Tract 9641.02, Summit County, UT (2,813)
- Census Tract 9601, Daggett County, UT (1,059)
- Census Tract 9642.03, Summit County, UT (103)
Top 10 Neighboring 5-Digit ZIP Code Tabulation Area (by Population) Neighboring 5-Digit ZIP Code Tabulation Area on the Map
- 84098, UT (17,282)
- 84032, UT (17,249)
- 82930, UT (14,614)
- 84036, UT (6,045)
- 84017, UT (3,556)
- 84055, UT (1,406)
- 84046, UT (793)
- 84061, UT (391)
- 84031, UT (259)
- 82938, WY (227)
Data
Demographic, Population, Households, and Housing Units
** Data sources from census 2010 **
Show Data on Map
Download Full List as CSV
Download Quick Sheet as CSV
| Subject | This Area | Summit County | Utah | National |
|---|---|---|---|---|
| POPULATION | ||||
| Total Population Map | 6,763 | 36,324 | 2,763,885 | 308,745,538 |
| POPULATION, HISPANIC OR LATINO ORIGIN | ||||
| Not Hispanic or Latino Map | 6,166 | 32,134 | 2,405,545 | 258,267,944 |
| Hispanic or Latino Map | 597 | 4,190 | 358,340 | 50,477,594 |
| POPULATION, RACE | ||||
| White alone Map | 6,301 | 32,890 | 2,379,560 | 223,553,265 |
| Black or African American alone Map | 27 | 154 | 29,287 | 38,929,319 |
| American Indian and Alaska Native alone Map | 18 | 122 | 32,927 | 2,932,248 |
| Asian alone Map | 16 | 446 | 55,285 | 14,674,252 |
| Native Hawaiian and Other Pacific Islander alone Map | 3 | 38 | 24,554 | 540,013 |
| Some Other Race alone Map | 335 | 2,077 | 166,754 | 19,107,368 |
| Two or More Races Map | 63 | 597 | 75,518 | 9,009,073 |
| POPULATION, SEX | ||||
| Male Map | 3,485 | 18,724 | 1,388,317 | 151,781,326 |
| Female Map | 3,278 | 17,600 | 1,375,568 | 156,964,212 |
| POPULATION, AGE (18 YEARS) | ||||
| 18 years and over Map | 4,591 | 26,254 | 1,892,858 | 234,564,071 |
| Under 18 years | 2,172 | 10,070 | 871,027 | 74,181,467 |
| POPULATION, AGE | ||||
| Under 5 years | 587 | 2,468 | 263,924 | 20,201,362 |
| 5 to 9 years | 615 | 2,873 | 249,572 | 20,348,657 |
| 10 to 14 years | 606 | 2,943 | 227,951 | 20,677,194 |
| 15 to 17 years | 364 | 1,786 | 129,580 | 12,954,254 |
| 18 and 19 years | 148 | 780 | 91,510 | 9,086,089 |
| 20 years | 51 | 307 | 42,204 | 4,519,129 |
| 21 years | 58 | 288 | 45,173 | 4,354,294 |
| 22 to 24 years | 177 | 1,251 | 139,142 | 12,712,576 |
| 25 to 29 years | 391 | 2,158 | 229,554 | 21,101,849 |
| 30 to 34 years | 481 | 2,271 | 216,133 | 19,962,099 |
| 35 to 39 years | 497 | 2,570 | 178,401 | 20,179,642 |
| 40 to 44 years | 438 | 2,883 | 154,074 | 20,890,964 |
| 45 to 49 years | 524 | 3,225 | 154,831 | 22,708,591 |
| 50 to 54 years | 496 | 3,205 | 152,133 | 22,298,125 |
| 55 to 59 years | 427 | 2,627 | 133,122 | 19,664,805 |
| 60 and 61 years | 139 | 861 | 46,154 | 7,113,727 |
| 62 to 64 years | 156 | 1,060 | 60,965 | 9,704,197 |
| 65 and 66 years | 106 | 581 | 34,485 | 5,319,902 |
| 67 to 69 years | 131 | 709 | 44,995 | 7,115,361 |
| 70 to 74 years | 152 | 655 | 58,744 | 9,278,166 |
| 75 to 79 years | 91 | 399 | 45,835 | 7,317,795 |
| 80 to 84 years | 69 | 234 | 34,412 | 5,743,327 |
| 85 years and over | 59 | 190 | 30,991 | 5,493,433 |
| MEDIAN AGE BY SEX | ||||
| Both sexes Map | 33.80 | 37.10 | 29.20 | 37.20 |
| Male Map | 32.90 | 36.40 | 28.70 | 35.80 |
| Female Map | 35.20 | 37.80 | 29.70 | 38.50 |
| HOUSEHOLDS | ||||
| Total Households Map | 2,292 | 12,990 | 877,692 | 116,716,292 |
| HOUSEHOLDS, HOUSEHOLD TYPE | ||||
| Family households: Map | 1,757 | 9,271 | 660,234 | 77,538,296 |
| Husband-wife family Map | 1,501 | 7,891 | 535,827 | 56,510,377 |
| Other family: Map | 256 | 1,380 | 124,407 | 21,027,919 |
| Male householder, no wife present Map | 90 | 520 | 38,858 | 5,777,570 |
| Female householder, no husband present Map | 166 | 860 | 85,549 | 15,250,349 |
| Nonfamily households: Map | 535 | 3,719 | 217,458 | 39,177,996 |
| Householder living alone Map | 434 | 2,609 | 164,018 | 31,204,909 |
| Householder not living alone Map | 101 | 1,110 | 53,440 | 7,973,087 |
| HOUSEHOLDS, HISPANIC OR LATINO ORIGIN OF HOUSEHOLDER | ||||
| Not Hispanic or Latino householder: Map | 2,155 | 12,049 | 793,895 | 103,254,926 |
| Hispanic or Latino householder: Map | 137 | 941 | 83,797 | 13,461,366 |
| HOUSEHOLDS, RACE OF HOUSEHOLDER | ||||
| Householder who is White alone | 2,188 | 12,194 | 785,761 | 89,754,352 |
| Householder who is Black or African American alone | 7 | 38 | 8,252 | 14,129,983 |
| Householder who is American Indian and Alaska Native alone | 4 | 36 | 9,152 | 939,707 |
| Householder who is Asian alone | 4 | 126 | 16,474 | 4,632,164 |
| Householder who is Native Hawaiian and Other Pacific Islander alone | 1 | 9 | 5,253 | 143,932 |
| Householder who is Some Other Race alone | 75 | 458 | 39,501 | 4,916,427 |
| Householder who is Two or More Races | 13 | 129 | 13,299 | 2,199,727 |
| HOUSEHOLDS, HOUSEHOLD TYPE BY HOUSEHOLD SIZE | ||||
| Family households: Map | 1,757 | 9,271 | 660,234 | 77,538,296 |
| 2-person household Map | 641 | 3,616 | 222,850 | 31,882,616 |
| 3-person household Map | 348 | 1,977 | 130,366 | 17,765,829 |
| 4-person household Map | 370 | 2,010 | 126,309 | 15,214,075 |
| 5-person household Map | 215 | 972 | 88,513 | 7,411,997 |
| 6-person household Map | 120 | 405 | 52,732 | 3,026,278 |
| 7-or-more-person household Map | 63 | 291 | 39,464 | 2,237,501 |
| Nonfamily households: Map | 535 | 3,719 | 217,458 | 39,177,996 |
| 1-person household Map | 434 | 2,609 | 164,018 | 31,204,909 |
| 2-person household Map | 79 | 788 | 34,119 | 6,360,012 |
| 3-person household Map | 15 | 192 | 9,684 | 992,156 |
| 4-person household Map | 4 | 82 | 6,145 | 411,171 |
| 5-person household Map | 1 | 33 | 1,688 | 126,634 |
| 6-person household Map | 1 | 10 | 1,457 | 48,421 |
| 7-or-more-person household Map | 1 | 5 | 347 | 34,693 |
| HOUSING UNITS | ||||
| Total Housing Units Map | 4,945 | 26,545 | 979,709 | 131,704,730 |
| HOUSING UNITS, OCCUPANCY STATUS | ||||
| Occupied Map | 2,292 | 12,990 | 877,692 | 116,716,292 |
| Vacant Map | 2,653 | 13,555 | 102,017 | 14,988,438 |
| HOUSING UNITS, OCCUPIED, TENURE | ||||
| Owned with a mortgage or a loan Map | 1,330 | 7,842 | 471,931 | 52,979,430 |
| Owned free and clear Map | 490 | 2,055 | 146,206 | 23,006,644 |
| Renter occupied Map | 472 | 3,093 | 259,555 | 40,730,218 |
| HOUSING UNITS, VACANT, VACANCY STATUS | ||||
| For rent Map | 16 | 1,251 | 20,176 | 4,137,567 |
| Rented, not occupied Map | 2 | 42 | 1,408 | 206,825 |
| For sale only Map | 39 | 543 | 14,580 | 1,896,796 |
| Sold, not occupied Map | 6 | 111 | 2,828 | 421,032 |
| For seasonal, recreational, or occasional use Map | 2,498 | 11,268 | 47,978 | 4,649,298 |
| For migrant workers Map | 0 | 3 | 232 | 24,161 |
| Other vacant Map | 92 | 337 | 14,815 | 3,652,759 |
| HOUSING UNITS, OCCUPIED, AVERAGE HOUSEHOLD SIZE BY TENURE | ||||
| Total: Map | 2.95 | 2.79 | 3.10 | 2.58 |
| Owner occupied Map | 2.96 | 2.75 | 3.21 | 2.65 |
| Renter occupied Map | 2.90 | 2.90 | 2.82 | 2.44 |
| HOUSING UNITS, OCCUPIED, TENURE BY RACE OF HOUSEHOLDER | ||||
| Owner occupied: Map | 1,820 | 9,897 | 618,137 | 75,986,074 |
| Householder who is White alone Map | 1,778 | 9,592 | 572,530 | 63,446,275 |
| Householder who is Black or African American alone Map | 4 | 16 | 2,896 | 6,261,464 |
| Householder who is American Indian and Alaska Native alone Map | 2 | 17 | 4,825 | 509,588 |
| Householder who is Asian alone Map | 4 | 77 | 10,203 | 2,688,861 |
| Householder who is Native Hawaiian and Other Pacific Islander alone Map | 0 | 1 | 2,469 | 61,911 |
| Householder who is Some Other Race alone Map | 26 | 122 | 18,506 | 1,975,817 |
| Householder who is Two or More Races Map | 6 | 72 | 6,708 | 1,042,158 |
| Renter occupied: Map | 472 | 3,093 | 259,555 | 40,730,218 |
| Householder who is White alone Map | 410 | 2,602 | 213,231 | 26,308,077 |
| Householder who is Black or African American alone Map | 3 | 22 | 5,356 | 7,868,519 |
| Householder who is American Indian and Alaska Native alone Map | 2 | 19 | 4,327 | 430,119 |
| Householder who is Asian alone Map | 0 | 49 | 6,271 | 1,943,303 |
| Householder who is Native Hawaiian and Other Pacific Islander alone Map | 1 | 8 | 2,784 | 82,021 |
| Householder who is Some Other Race alone Map | 49 | 336 | 20,995 | 2,940,610 |
| Householder who is Two or More Races Map | 7 | 57 | 6,591 | 1,157,569 |
| HOUSING UNITS, OCCUPIED, TENURE BY HISPANIC OR LATINO ORIGIN OF HOUSEHOLDER | ||||
| Owner occupied: Map | 1,820 | 9,897 | 618,137 | 75,986,074 |
| Not Hispanic or Latino householder Map | 1,763 | 9,624 | 575,835 | 69,617,625 |
| Hispanic or Latino householder Map | 57 | 273 | 42,302 | 6,368,449 |
| Renter occupied: Map | 472 | 3,093 | 259,555 | 40,730,218 |
| Not Hispanic or Latino householder Map | 392 | 2,425 | 218,060 | 33,637,301 |
| Hispanic or Latino householder Map | 80 | 668 | 41,495 | 7,092,917 |
| HOUSING UNITS, OCCUPIED, TENURE BY HOUSEHOLD SIZE | ||||
| Owner occupied: Map | 1,820 | 9,897 | 618,137 | 75,986,074 |
| 1-person household Map | 311 | 1,807 | 94,206 | 16,453,569 |
| 2-person household Map | 608 | 3,588 | 188,793 | 27,618,605 |
| 3-person household Map | 283 | 1,671 | 96,780 | 12,517,563 |
| 4-person household Map | 307 | 1,650 | 96,305 | 10,998,793 |
| 5-person household Map | 169 | 743 | 69,008 | 5,057,765 |
| 6-person household Map | 89 | 278 | 42,286 | 1,965,796 |
| 7-or-more-person household Map | 53 | 160 | 30,759 | 1,373,983 |
| Renter occupied: Map | 472 | 3,093 | 259,555 | 40,730,218 |
| 1-person household Map | 123 | 802 | 69,812 | 14,751,340 |
| 2-person household Map | 112 | 816 | 68,176 | 10,624,023 |
| 3-person household Map | 80 | 498 | 43,270 | 6,240,422 |
| 4-person household Map | 67 | 442 | 36,149 | 4,626,453 |
| 5-person household Map | 47 | 262 | 21,193 | 2,480,866 |
| 6-person household Map | 32 | 137 | 11,903 | 1,108,903 |
| 7-or-more-person household Map | 11 | 136 | 9,052 | 898,211 |
Loading...